Tutorial: Pushing plots to the Portal
Tutorial_Plots_to_Portal.RmdPushing plots to the Portal
The Insights module in the Portal is a space where you can collect plots generated in Workbench and organize them into figures and narratives. To push plots to the Insights module, use the function upload_image() from emconnect.
Setup
To run upload_image(), you will need to specify the name of your study.
STUDY_NAME <- "study_name"And you will need a plot to upload.
sm <- readRDS("sm_post_clustering.RDS")

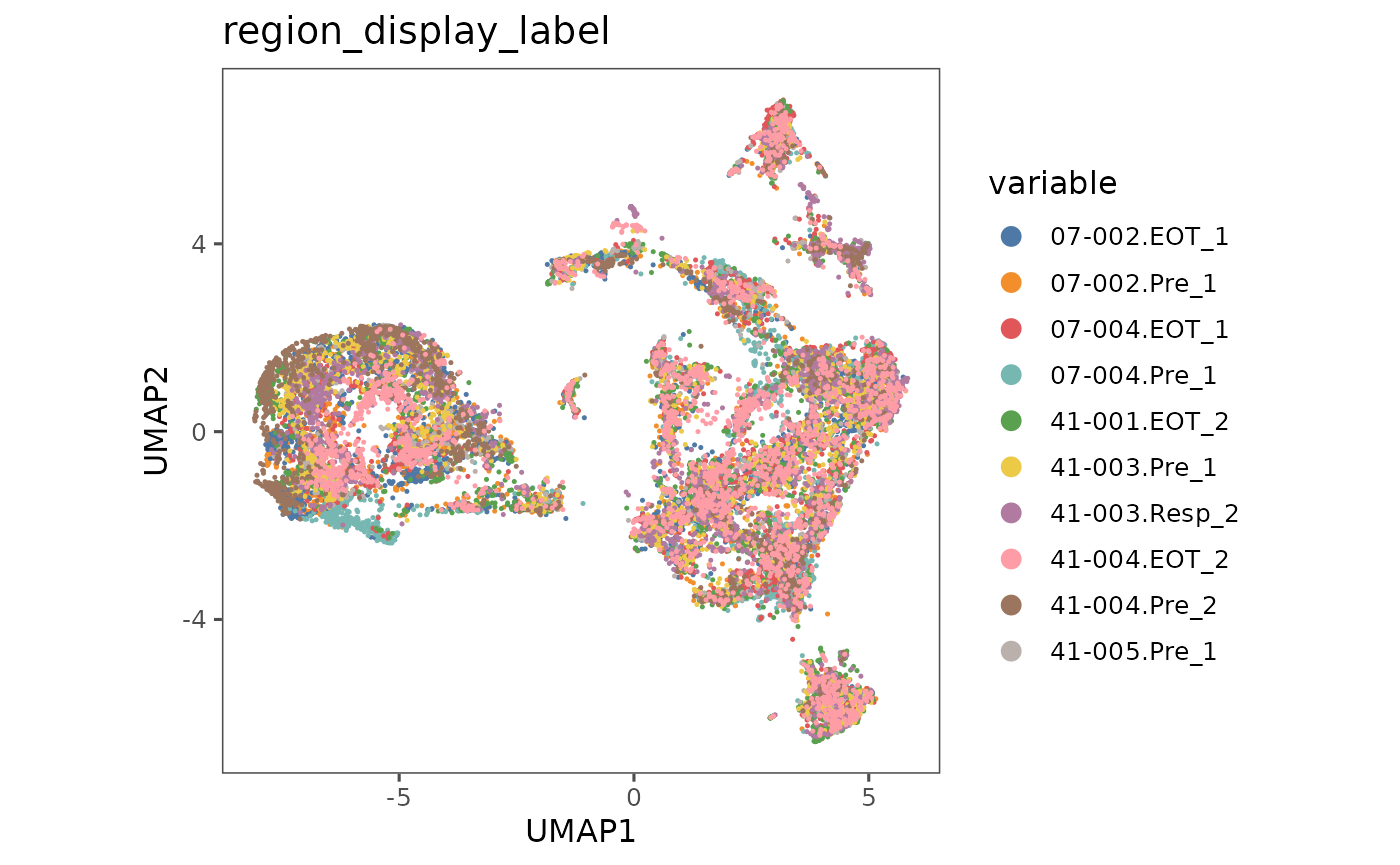
demo_plot <- plotRepresentation(sm,
                                representation = "umap",
                                what = "region_display_label")
#>   By analysis: 'combined'
#>

demo_plot
The Insights module
For an overview of how the Insights module works, see the Portal user manual page.
Briefly:
The Insights module has two levels of organization, Stories and Cards
Each plot is associated with a Card, and Cards can be associated with Stories
If there are multiple plots on a Card, a dropdown menu at the top of the card will show the file name of each plot to allow you to select which plot is showing
Each plot also has a small description that shows above it on the Card
If you want to overwrite a plot, just upload another plot with the same filename
Run upload_image()
The file extension specifies which graphical device to use to generate the plot. Supported file types are .png, .jpeg, .tiff, .bmp, and .svg.
For example, this will upload a .svg version of the plot.
upload_image(demo_plot,
             file.name = "demo_plot.svg",
             card.title = "UMAP",
             study_name = STUDY_NAME,
             plot.description = "UMAP colored by region",
             # You may want to try multiple iterations of uploading
             # with different values of height and width to find optimal values
             height = 7,
             width = 7)
This file format is often the best choice, since it will scale well and is easily editable in third party image formatting tools such as Adobe Illustrator.
You can specify other parameters to
?svgliteif you want to change the formatting of the image. Just add those parameters to yourupload_imagecall and they will be passed tosvglite.
If you would like to choose another file format, just change the file extension in file.name. Here is an example upload as a .png.
upload_image(demo_plot,
             file.name = "demo_plot.png",
             card.title = "UMAP",
             study_name = STUDY_NAME,
             plot.description = "UMAP colored by region, now as a png",
             units = "in",
             height = 7, # Play with height and width to make sure the plot looks nice
             width = 7,
             res = 150)  # Resolution should be at least 150 ppi to be legible
Note that different parameters need to be specified to
png. See?pngfor more details of arguments that can be passed to alter the formatting.